In the first article of this two-part series, Alex Scott, a transportation researcher with more than two decades in the trucking industry, examined current standards for measuring truck emissions. Here he shares a science-based, data-driven method for improving how Scope 3 truck emissions are measured.

I have developed a better approach to calculating scope 3 truck emissions that falls between the two extremes of direct measurement of all emissions using tailpipe monitoring and estimating emissions based on a single one-size-fits-all emissions factor.
My approach estimates emissions based on the specific carriers that haul the loads and the trucks that those carriers operate. Carriers have different fleets and truck procurement strategies. As a result, each carrier has its own unique emissions profile.
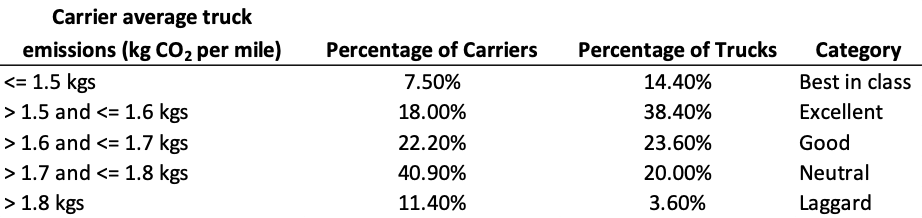
As shown in Table 1, over half of the carriers on the road have average emissions rates greater than 1.7 kgs of CO2 per mile. On the other hand, about 7.5% of carriers (representing 14.4% of trucks) operate fleets that average less than 1.5 kgs of CO2 per mile, which I classify as “best in class.” There are over 60,000 carriers with five trucks or less—almost none of which are in the EPA’s SmartWay program—that operate excellent or best-in-class fleets.
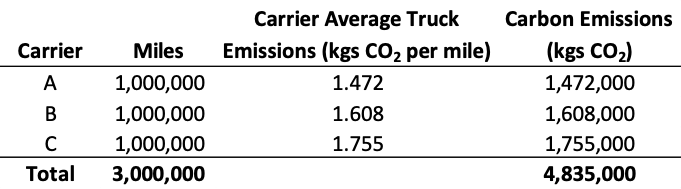
My database of hundreds of thousands of carriers and millions of trucks can be used to accurately estimate a shipper’s scope 3 truck emissions and improve upon the deficiencies of the single-factor method. Consider a simplified example in which a shipper used three carriers last year, and each carrier drove 1,000,000 truckload miles (see Table 2). Because each carrier has its own emissions rate (based on its trucks), a different amount of carbon is emitted into the atmosphere—even though they all drove the same number of miles.
Carrier emissions factors are much more accurate than the single emissions factor. When I analyzed millions of truck trips for which I knew the model year of the truck, the carrier emissions factors deviated only 4.2% on average from the truck-level emissions factor. When I used the single emissions factor, the average error was 14.5%. Carrier emissions factors reduced error by about 72%.
Carrier emissions factors would also reward and incentivize shippers to adopt cleaner carriers (and, therefore, carriers to adopt cleaner trucks). In the example above, if the shipper replaced carrier C with carrier A, then the shipper’s scope 3 carbon emissions would drop by 5.9%. For a realistic supply chain, this could easily reduce CO2 emissions by millions of kgs per year. If the shipper were willing to pay more to reduce emissions (by using cleaner carriers), this preference would incentivize carriers to improve their emissions rates by adopting cleaner trucks. A sound scope 3 measurement system could empower consumers, investors, and governments to influence shippers, who then influence carriers.
A final advantage of carrier-level emissions factors is that the data is readily available and straightforward to implement. With any scope 3 estimation strategy, there is a trade-off between the granularity of data, the accuracy of a measure, and the cost of collecting, storing, and maintaining the data.
As illustrated in Figure 1 below, as increasingly granular data is collected at increasingly higher costs, the gains in accuracy of the estimated scope 3 emissions become smaller and smaller. Shippers already collect data on the carriers they select in procurement events, and my comprehensive database contains the emissions profiles of hundreds of thousands of carriers and millions of trucks. Measuring carbon emissions by considering the carrier that moved the load is a readily and immediately implementable endeavor.

Advantages of Calculating Carrier-Level Versus Truck-Level Emissions Factors
Another potential approach to measuring emissions would be to consider the truck, as opposed to the carrier, that hauled the load—a solution that I also have the technology to do.
This approach has several drawbacks compared to carrier-level measures:
First, shippers do not select trucks; they select carriers. When a load from a shipper materializes, the carrier that accepts the load assigns the truck that can best move the load, usually to minimize empty miles to reposition the truck. If the shipper were to restrict the carrier’s choice of trucks by restricting the carrier’s options to trucks with fewer than 1.4 kg CO2 per mile (for example), the constraint could have the unintended consequence of increasing empty miles. Reducing empty miles should be the first-order objective, and selecting cleaner trucks would be the secondary objective. Shippers currently select carriers and then allow carriers to make optimal choices within their networks; we should keep it that way.
Second, truck-level data is not commonly shared between shippers and carriers, and doing so would require changes to thousands of systems as well as additional data to be collected. Third, truck-level data provides little additional informational value beyond carrier-level data, as noted above
Conclusion
To improve companies’ ability to measure scope 3 truck emissions, I have created a method and comprehensive data source using data on millions of trucks and hundreds of thousands of carriers.
The advantages of my approach include the following:
- It enables companies to accurately measure emissions.
- It is based on sound science, including emissions and data from authoritative sources.
- Data is collected, measured, and maintained by disinterested third parties (as opposed to self-reporting).
- It empowers shippers to choose carriers based on their emissions profiles and allows sustainably-minded shippers to exert their influence on the market.
- The data requirements are simple and standardized. All the data needed to estimate scope 3 transportation emissions can be extracted from existing transportation management systems.
- Objective, third-party assessments reduce the risk of “greenwashing” and associated penalties, which could be scrutinized and penalized by the SEC and FTC.
For more information, please reach out to me at ascott@utk.edu or alex@sustainlog.com.
Alex Scott is an associate professor of supply chain management and the Gerald T. Niedert Professor in the Haslam College of Business at the University of Tennessee, Knoxville. He has spent the last two decades researching and working in the transportation industry.
Listen to Alex Scott discuss the University of Tennessee, Knoxville – project44 Fleet Sustainability Index and what it could mean for supply chains.